Calculating AQI In HomeAssistant
Burn My Money, Not My Lungs
As of the time of this writing there are significant wildfires in my area. Usually they don’t bother me all that much, but, this time around they did. So I decided to go out and buy a couple IKEA STARKVIND1, these are nifty little devices as it seems IKEA has gone all in on Zigbee devices, so HomeAssistant integration was a breeze!
There is one small problem with buying air purifiers though, how do I know they actually work? IKEA isn’t exactly known for its quality. HEPA filter or not, its hard to know if these are sized appropriately for the rooms I placed them in, and how do I know if outside, is better or worse? You can probably see where this is going, after some research I ended up purchasing an AirGradient ONE2 and an AirGradient Open Air 3. There appears to be plenty of options for air quality sensors out there, but these caught my eye. AirGradient publishes data from sensors on their site in a nice open source4 map5 (no account needed), everything can be local, no app or account needed to setup/register the device, and exceptional integration in HomeAssistant. When I actually got the devices the setup was butter smooth, attach to a WiFi hotspot, attach to IOT network, watch HomeAssistant find it almost instantly. Sharing data upstream to AirGradient was also toggleable, with no loss of functionality, other than you obviously can not use the dashboard they provide on their website.
Data Means Nothing
Of course, without context/education, or some sort of guide values don’t mean anything to me. PM2.5 = 15.7µg/m3 or PM10 = 34.96µg/m3 tells me the numbers, but the numbers have no value to me. That’s where AQI comes in. The numbers still may not mean that much to me, but, the AQI standard does a few things for us:
- Numbers come with something we can intuit, categories.
- Categories come with standardized colors.
- The AQI standard normalizes different pollutant concentrations into the AQI index.
- Different pollutants, are more/less harmful at different concentrations, AQI takes that into account making different pollutants at different concentrations fall into the same AQI scale.
Guess what metric the AirGradient devices don’t publish? I did some research and was able to find the document that defines the US AQI standard6 published by the US EPA.
Calculating AQI
Calculating the US AQI is pretty straightforward, but there is a little more than just a formula to calculate the AQI. You need both the formula, and a data table they include. First, the data table, for this document I am going to only include the PM2.5 pollutants, and make some tweaks to the table to make it more clear (in my opinion):
PM2.5:
| PM2.5 Concentration (Cp) |
Break Point Low (BPLo) |
Break Point High (BPHi) |
AQI Low (ILo) |
AQI High (IHi) |
Category |
|---|---|---|---|---|---|
| 0.0 – 9.0 | 0.0 | 9.0 | 0 | 50 | Good |
| 9.1 – 35.4 | 9.1 | 35.4 | 51 | 100 | Moderate |
| 35.5 – 55.4 | 35.5 | 55.4 | 101 | 150 | Unhealthy for Sensitive Groups |
| 55.5 - 125.4 | 55.5 | 125.4 | 151 | 200 | Unhealthy |
| 125.5 - 225.4 | 125.5 | 225.4 | 201 | 300 | Very unhealthy |
| 225.5+ | 225.5 | 225 | 301+ | 301+ | Hazardous |
Next, the formula:
Where:
- Ip = The index for pollutant p (This is your AQI)
- Cp = The concentration of pollutant p (PM2.5) to the first decimal place
- BPLo = The concentration breakpoint that is less than or equal to Cp
- BPHi = The concentration breakpoint that is greater than or equal to Cp
- ILo = The AQI value corresponding to BPLo
- IHi = The AQI value corresponding to BPHi
PM2.5 is 1 decimal.
A Practice Example
Lets assume we have a PM2.5 == 15.68, let:
- Cp == 15
- ILo == 51
- IHi == 100
- BPLo == 9.1
- BPHi == 35.4
Step 01:
\[ \frac{100 - 51}{35.4 - 9.1} \left(15 - 9.1\right) + 51 = I_p \]Step 02:
\[ \frac{49}{26.3} \left(5.9\right) + 51 = I_p \]Step 03:
\[ 1.863(5.9) + 51 = I_p \]Step 04:
\[ 10.9917 + 51 = 61.9917 \]We have an AQI of 61.997 (or just 62). That’s great and all, but HomeAssistant isn’t going to let us plug a formula in like that. So now we need to put this into a format we can actually put into HomeAssistant, like this: (((100-51)/(35.4-9.1))*(15-9.1))+51
Intuiting The Data
Awesome, we have the data table, we have the formula, now how do we go from data/formula to actually making this useful in HomeAssistant? This is where things get so much easier than I was expecting, first we will create a helper template. The helper template will take a sensor from a device, then using a macro run the formula discussed above and generate a new sensor for said device.
Create An Average PM2.5 Sensor
The AQI score is time dependent, so we need to create a sensor that will get us an average over the past x period of time. I will be using the last one hour, this makes the AQI value fairly responsive to quick changes in air quality while not being too sensitive. To get started we need to create a new helper, from HomeAssistant:
- Select “Settings” (on the left)
- Select “Devices & services”
- Select “Helpers” (in the top right tab)
- Select “Create helper” (button on the bottom right)
- Find “Statistics”
When setting the template name, I would recommend something like “PM2.5 1 Hour Average”. This template sensor will be linked to a device, which will influence the full sensor name, so the sensor name should stay fairly clean and readable. Begin filling out the details:
- Name: PM2.5 1 Hour Average
- Entity:
YOUR PM2.5 SENSOR NAME HERE(my sensor name is:sensor.deck_outdoor_air_monitor_pm2_5) - Next
- Statistics Characteristics: Mean
- Next
- Max age: 1 hour
- Submit
This results in a new sensor for me to use: sensor.deck_outdoor_air_monitor_pm2_5_1_hour_average
Create An AQI Index Template
Before moving on here do note the following helper template is only for PM2.5 sensors. As discussed before different pollutants have varying levels of toxicity at different concentrations. If you wish to create an AQI index for a pollutant other than PM2.5 the template must be adjusted. Follow steps 1-4 from above:
- Find “Template”
- Select “Sensor”
Now begin filling out the fields, like so:
- Name: “AQI PM2.5 Index”
- Device class: Air Quality Index
- Device: The device your PM2.5 sensor is attached to
- State:
{% macro aqi(Cp, BPlo, BPhi, Ilo, Ihi) -%}
  {{(((Ihi-Ilo)/(BPhi - BPlo) * (Cp - BPlo)) + Ilo)|round(0)}}
{%- endmacro %}
{% set Cp = states('sensor.<THE SENSOR FROM THE LAST SECTION>')|round(1) %}
{% if Cp <= 9.0 %}
   {{aqi(Cp, 0, 9.0, 0, 50)}}
{% elif 9.0 < Cp <= 35.4 %}
   {{aqi(Cp, 9.1, 35.4, 51, 100)}}
{% elif 35.4 < Cp <= 55.4 %}
   {{aqi(Cp, 35.5, 55.4, 101, 150)}}
{% elif 55.4 < Cp <= 125.4 %}
   {{aqi(Cp, 55.5, 125.4, 151, 200)}}
{% elif 125.4 < Cp <= 225.4 %}
   {{aqi(Cp, 125.5, 225.4, 201, 300)}}
{% elif 225.4 < Cp %}
   {{aqi(Cp, 225.5, 500.4, 301, 500)}}
{% endif %}
Before moving on, check the “Preview” section at the bottom, make sure the AQI value is correct, and check the entity name.
Create An AQI Category Template
The nice part about the category template is that the categories are always associated with the same AQI value regardless of the pollutant. So an AQI value of 160 will always be “Unhealthy” regardless of the pollutant in question. Follow the steps from the last section to create another template, then begin filling out the fields, like so:
- Name: “AQI PM2.5 Category”
- Device: The device your sensor template is attached to
- State:
{% set aqi = int(states('sensor.<THE SENSOR FROM THE LAST SECTION>')) %}
{% if aqi <= 50 %}
   Good
{% elif 50 < aqi <= 100 %}
   Moderate
{% elif 100 < aqi <= 150 %}
   Unhealthy for Sensitive Groups
{% elif 150 < aqi <= 200 %}
   Unhealthy
{% elif 200 < aqi <= 300 %}
   Very Unhealthy
{% elif 300 < aqi %}
   Hazardous
{% else %}
   Unkown
{% endif %}
Create An AQI Index Mushroom Badge
This next section assumes you have the Mushroom add-on installed. The goal is to create a badge that will change colors based on the current AQI value. Like the category template above, the warning colors outlined in the documentation are always associated with the same AQI value regardless of pollutant. To start pick any dashboard, then the view you want to add this badge to:
- Click edit (the pencil in the top right)
- Click the “+” button to add a badge
- Click “By badge” tab
- Click “Mushroom Template”
Entity: THE AQI INDEX SENSOR WE MADE FIRST
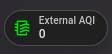
Label: External AQI
Content: {{ states(entity) }}
Color:
{% set aqi = states(entity) | float %}
{% if aqi <= 50 %}
  rgb(0,228,0)
{% elif 50 < aqi <= 100 %}
  rgb(255,255,0)
{% elif 100 < aqi <= 150 %}
  rgb(255,126,0)
{% elif 150 < aqi <= 200 %}
  rgb(255,0,0)
{% elif 200 < aqi <= 300 %}
  rgb(143,63,151)
{% elif 300 < aqi %}
  rgb(126,0,35)
{% else %}
  grey
{% endif %}
Icon: mdi:air-filter
Interactions: (Add what you want, I chose “More info”)
In the end the badge should look like this:
Archived Sources
Each source listed above links to the relevant external resource, however for the sake of clarity, or in case any site becomes unavailable, for whatever reason, archived sources are listed below:
- IKEA STARKVIND
- AirGradient ONE
- AirGradient Open Air
- AirGradient Open Source Map
- AirGradient Map
- This did not archive well, but it hopefully wont be needed anytime soon.
- Technical Assistance Document for the Reporting of Daily Air Quality – the Air Quality Index (AQI)